EGI scientists Rasoul Sorkhabi, Ph.D., Setoyama, Ph.D., and Palash Panja, Ph.D., were delighted that two of their presentations were featured in the August and September issues of the AAPG Explorer magazine– one on the ranking of US shale plays and the second on the Middle East.
From AAPG Explorer magazine:
David Brown, Explorer Correspondent
Which Are the Best Shale Plays in the U.S.?
What are the highest-ranked shale oil plays in the United States? Here’s an easy answer: It depends on who’s doing the ranking.
More to the point, it depends on the evaluation criteria and ranking methodology applied.
A new analysis from the University of Utah’s Energy and Geoscience Institute ranks 12 U.S. tight-oil shale formations based on data from almost 37,000 producing horizontal wells, using a specially designed software package.
“We should not view shale plays as simply an engineering issue – that is, simply frac them irrespective of their geological conditions. We believe that geological parameters have huge impacts on the productivity and hydrocarbon recovery of the shale formation,” said Rasoul Sorkhabi, University of Utah research professor.
“Consider for example, the Wolfcamp formation in the Delaware basin and Midland basin of the Permian superbasin. It is the same formation, same stratigraphic age (Permian) and same lithology,” he said.
However, the production performance of Wolfcamp in the Delaware and in the Midland are drastically different, Sorkhabi noted.
The Wolfcamp in the Delaware basin is the best among all the 12 shale plays examined by EGI, he said, “while Wolfcamp in Midland has one of the lowest production performance (ratings) among the shale plays.
“This means that even with the same drilling/completion/stimulation technology applied, the same formation in Delaware and in Midland may behave very differently – one excellently, the other poorly,” he added.
“This is related to the geological and basinal conditions in which these two Wolfcamp formations are situated. Delaware is a deep basin with higher thermal maturity and (is) highly pressurized, while Midland is relatively a shallow basin with less thermal maturity and less reservoir pressure,” Sorkhabi explained.
“In other words, ‘Not all shales play the same game,’ as I have often said,” he stated.
Unconventional resource evaluations are more than purely academic exercises. They can help determine which plays attract investment funding, and how much investment, and where plays will be aggressively drilled.
The EGI rankings address tight oil production and do not include the large but primarily natural gas-producing Marcellus shale play. Gas production was actually a negative in the study. As a gas-prone reservoir, the Barnett shale ranked the lowest in oil production out of the plays analyzed.
While other shale-play rankings differ, including those that primarily focus on initial output or play size, all studies agree on the critical importance of tight oil to U.S. production.
The U.S. Energy Information Administration estimated that last year around 2.84 billion barrels of crude oil, or about 7.79 million barrels per day, were produced directly from tight-oil resources in the United States. That accounted for roughly 66 percent of total U.S. crude production in 2022.
EGI’s analysis of unconventional oil plays will be described in an Aug. 31 poster presentation, “Ranking of U.S. shale plays using data science: Insights into oil production performance,” at the upcoming International Meeting for Applied Geoscience and Energy in Houston.
Sorkhabi prepared the presentation with his University of Utah colleagues and co-authors Palash Panja, research assistant professor in chemical engineering, and Milind Deo, professor of chemical engineering.
If you would like to know more about these presentations and studies, please contact the authors.
Calculating NCPI
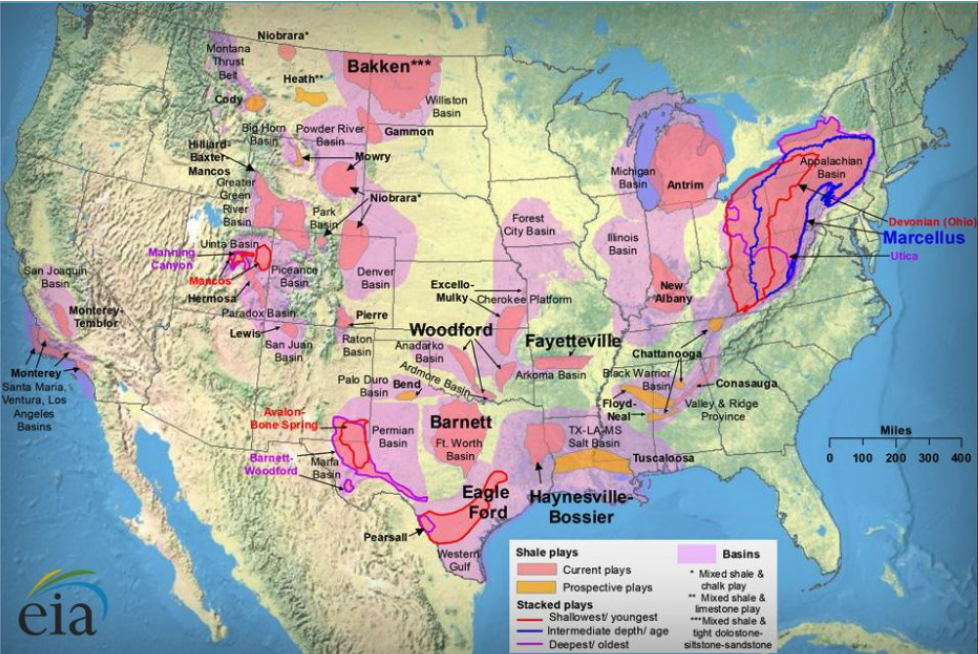
In alphabetical order, with geological setting and number of wells included in the study, the 12 plays analyzed and ranked by EGI are:
▪ Austin Chalk (Gulf Coast West, Cretaceous,
1,196 wells)
▪ Bakken (Williston, Devonian, 13,397)
▪ Barnett (Fort Worth, Mississippian, 750)
▪ Bone Spring (Delaware, Permian, 1,778)
▪ Eagle Ford (Gulf Coast Central, Cretaceous, 636)
▪ Eagle Ford (Gulf Coast West, Cretaceous, 10,237)
▪ Niobrara (Denver, Cretaceous, 4,069)
▪ Niobrara (Powder River, Cretaceous, 212)
▪ Spraberry (Midland, Permian, 30)
▪ Wolfcamp (Delaware, Permian, 2,060)
▪ Wolfcamp (Midland, Permian, 1,534)
▪ Woodford (Anadarko, Devonian, 743)
“These shale formations account for the bulk of tight shale oil production that has revolutionized the U.S. oil and gas landscape since 2010, thanks to advances in stimulation technologies,” Sorkhabi said.
“So, if the shales play different games, how can we characterize them? In our approach, we do reverse engineering of well production data to geological and petroleum system conditions,” he explained.
Sorkhabi said EGI evaluated the shale plays using the petroleum system approach by considering such factors as lithology, thermal maturity, formation thickness, depth, organic richness, porosity including pore porosity and organic porosity, permeability including matrix permeability and natural fracture permeability.
The computer software package ShaleSmart, developed at EGI, was utilized for the analysis.
“It is specific for shale plays and has various functionalities,” Sorkhabi said.
“The input data include well log data and completion/production data. It can predict – based on calculations, assumptions and input data – such parameters as kerogen/organic porosity, formation permeability, volume of oil and gas in place and optimization of field development,” he noted.
“We developed a normalized cumulative production index, a way to measure the production performance, and also to be able to compare various wells and shale plays in a consistent manner. NCPI gives a value in the units of stock tank barrel per each foot per each month,” or STB/ft/mo, he said.
“NCPI is basically a key performance indicator. We calculated it for each and every well in our database, and then calculated a median NCPI value for each shale formation. This was the basis for our ranking of the shale plays,” Sorkhabi explained.
“Of course, our conclusions and comparisons are on first-order scale. The NCPI has a range of values for each shale play, but for a first-order comparison we calculated the median value,” he said.
Altogether, EGI used data from 36,642 horizontal oil wells from the 12 shale plays. Sorkhabi characterized them as thick black shales with porosities below 10 percent, kerogen types II, total organic carbon content of 2-10 percent and Ro vitrinite reflectance of 0.8-1.0 percent.
“Note that we have focused on essentially oil wells, not those wells which are essentially gas producing. Also, we used only horizontal wells, and wells with at least 24 months of production. We kept these criteria for all the wells analyzed,” he said.
In addition to highlighting the relative strengths and weaknesses of a dozen shale plays, the EGI analysis also shows the breadth of the U.S. shale-oil resource. Some analysts predicted that U.S. oil output would go into decline this year, as the most productive shale areas mature.
But the EIA, in its July Short-Term Energy Outlook, now projects overall U.S. crude production to reach 12.85 million barrels per day in 2024, an all-time high.
The AAPG EXPLORER is the monthly magazine of the American Association of Petroleum Geologists that covers news of interest to the AAPG membership. Contents include coverage of the entire span of energy interest, with emphasis on exploration for hydrocarbons and energy minerals. Breaking news stories, features, profiles of personalities, comment columns and Association information is included. The AAPG EXPLORER is read by more than 42,000 members and friends of the Association in 129 countries. https://explorer.aapg.org/story/articleid/65748